Nowadays, designing a website is all about gathering important data and analyzing it. This way, your design is aligned with your users’ needs. There are popular tools in this field, like Google Analytics, that give you vital information and statistics about your website, but there are a number of very helpful features that these tools lack. WatchThemLive and Microsoft Clarity are examples of website tracking tools that offer unique features like tracking, measuring, and reporting user activity and behavior. This information helps you improve your user experience to a great extent.
WatchThemLive and Microsoft Clarity have both been launched in 2020. Both of them are extremely powerful tools, but, of course, they’re not the same. Each one has its own unique features. In this post, we compare WatchThemLive and Microsoft Clarity and go through the pros and cons of each to give you a comprehensive insight into their differences.
This table can give you a basic knowledge of their features:
| WatchThemLive | Microsoft Clarity | |
| Free Plan | ✅ | ✅ |
| Session Recording | ✅ | ✅ |
| Heatmaps | ✅ | ✅ |
| Scroll Maps | ❌ | ✅ |
| Exporting Reports | ✅ | ✅ |
| User Profiling | ✅ | ❌ |
| Downloading Sessions | ❌ | ✅ |
| Intuitive User Interface | ✅ | ❌ |
| Goal Tracking | ✅ | ❌ |
WatchThemLive vs. Microsoft Clarity: User Interface
Probably the most important thing that differentiates these two is the level of their interface complexity. WatchThemLive has a very straightforward interface. Even when you enter your dashboard on WatchThemLive for the first time, you can easily find the information you’re looking for without getting confused.
On the other hand, Clarity can be overwhelming for a user who has no prior experience.
WatchThemLive vs. Microsoft Clarity: Features
WatchThemLive and Microsoft Clarity have several similar features but the way each feature works is different on one compared to its counterpart in the other. Below we go through their features, examine them and see what their differences are.
Analytics
After you enter your dashboard on WatchThemLive, the first things that catch your eyes are:
a brief report on the number of page views, sessions, and visitors, and a graph that shows how these numbers have changed through a set period of time.
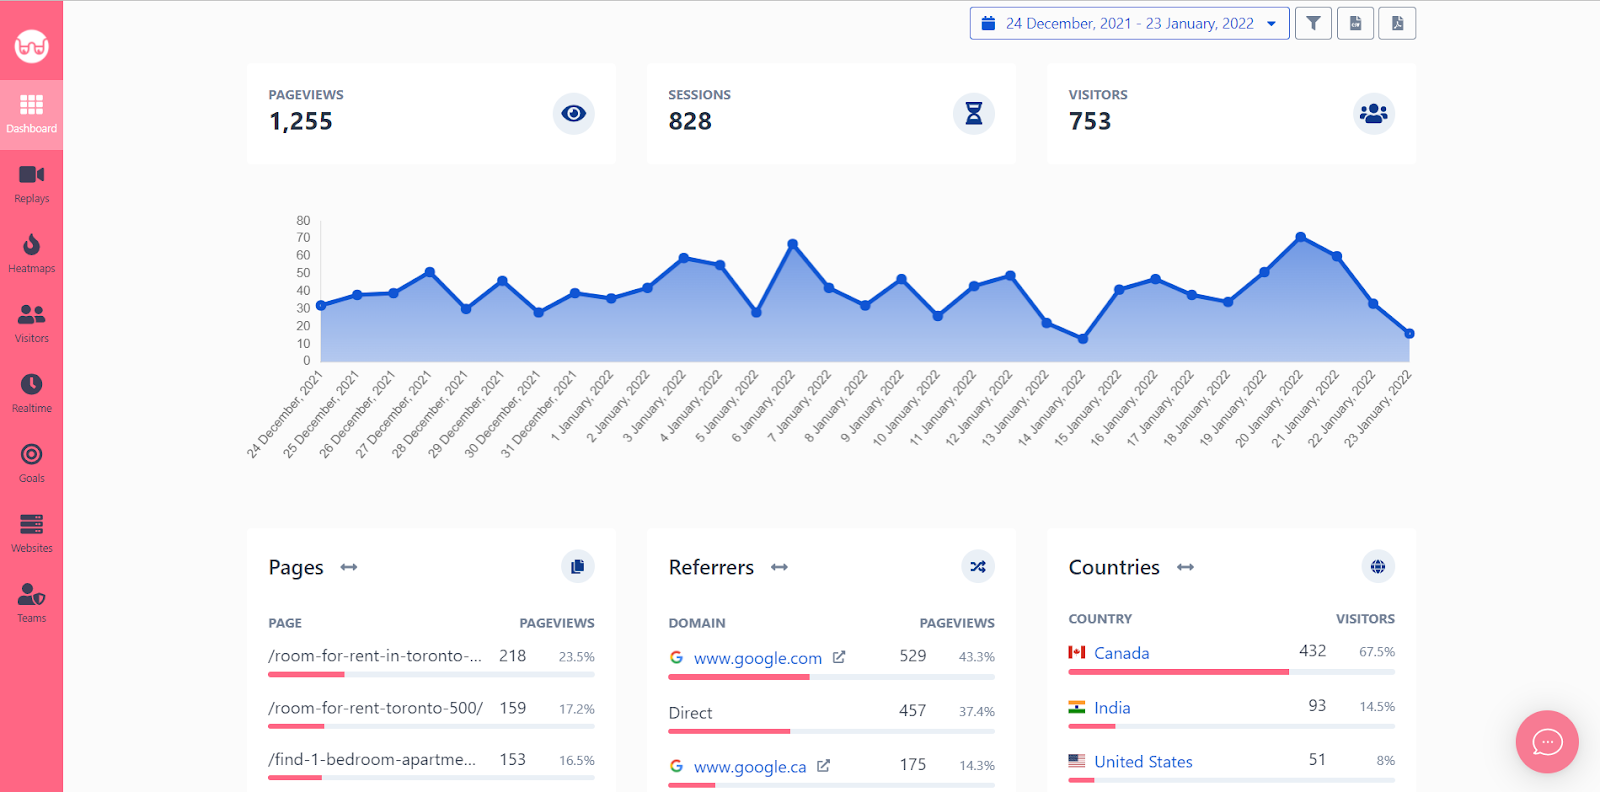
Below the graph, there are nine neatly designed columns in which you can see a list of some important data such as the most viewed pages, referrers, countries from which your users visit your website, etc. There’s also a column for UTMs (UTM codes allow you to track the performance of each link you share and determine where your traffic is coming from.)
WatchThemLives enables you to choose which period you want the data to be in so that you can easily compare your data in different periods of time. You can also create and modify filters to segment and check only the data that you need.
Another useful option that WatchThemLive gives you is exporting the data in PDF and CSV format.
In Microsoft Clarity, a section on the top of your dashboard shows information, including the number of sessions, pages per session, scroll depth, and time spent.
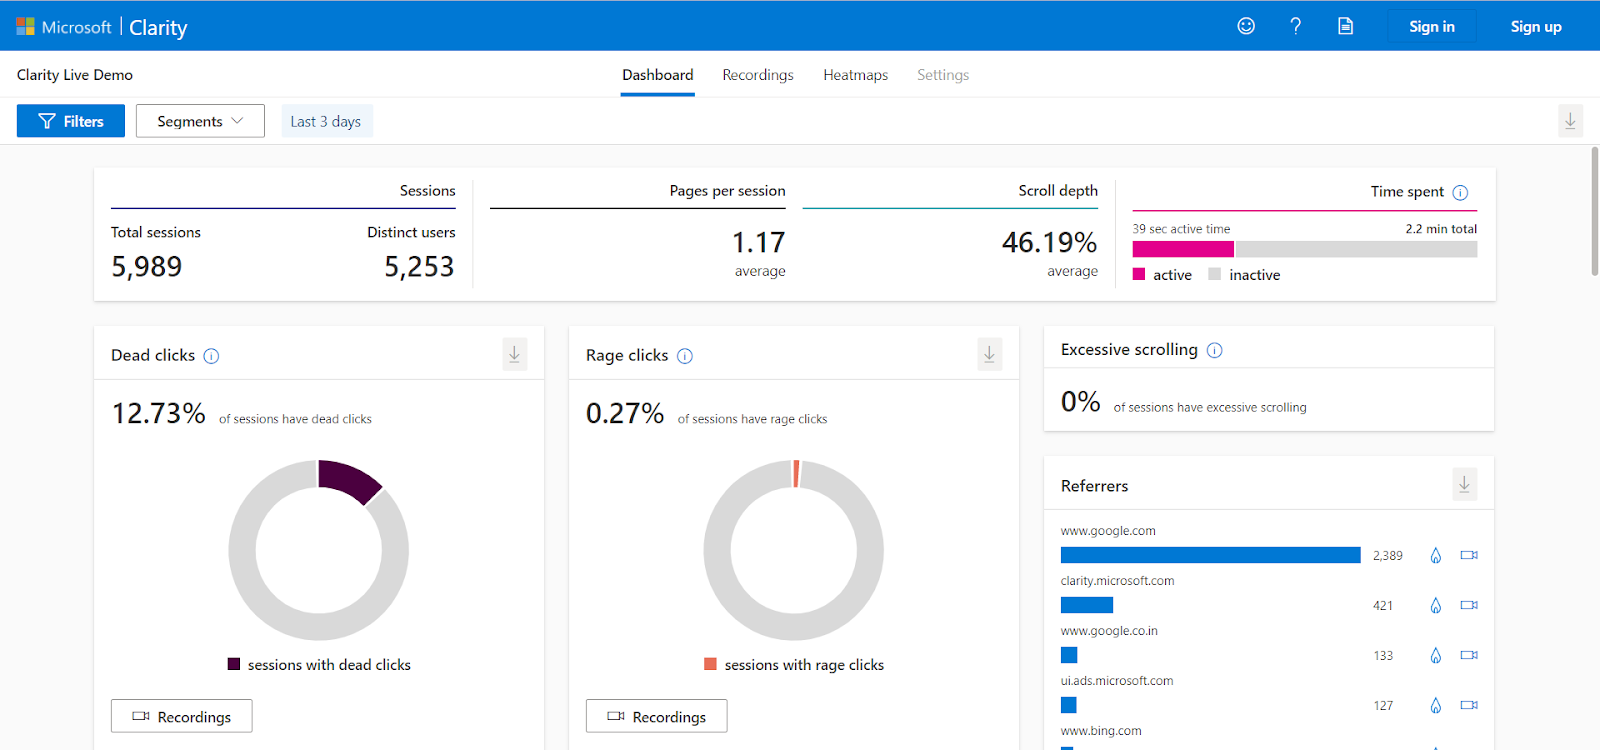
Below this section, tons of information is scattered across the page. These numbers are important and useful, but the way they are presented can be confusing to a lot of users.
These sections include dead clicks, rage clicks, javascript errors, operating systems, etc. Some of these sections are accompanied by pie charts to visualize the information.
You have the option to filter your data in Microsoft Clarity, just like in WatchThemLive.
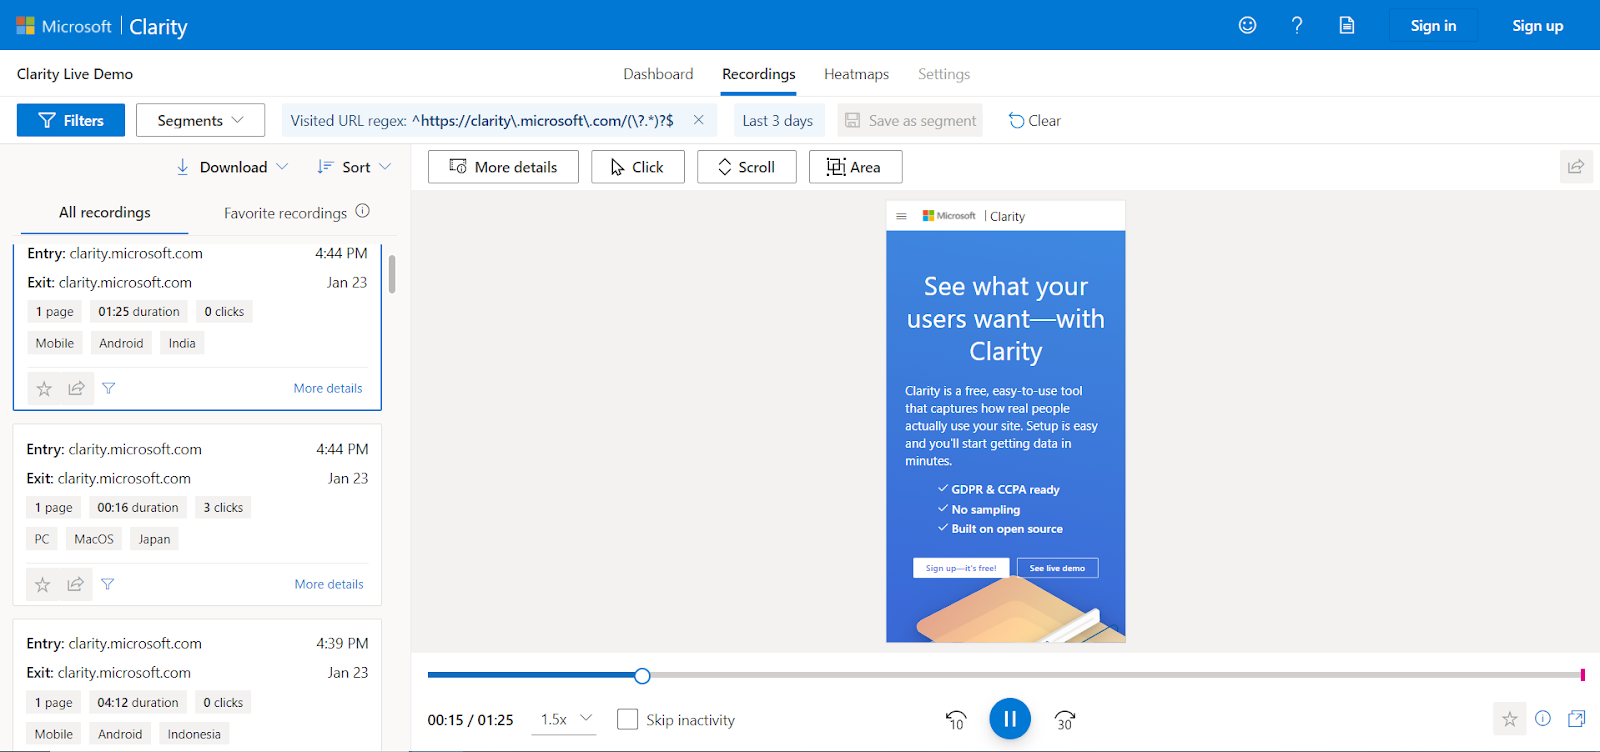
Session Replays
Using WatchThemLive Session Recording, you can watch every move of your users, from clicks to mouse flow. With session recording, you can find the reason why so many visitors don’t convert. Fix the bugs and pain points to enhance your user experience, and optimize your website’s conversion rate.
You can easily apply various filters on the recordings to specify what type of information you’re looking for. For example, you can filter the list to only watch the journey of users that visited your website on their phones or with a specific operating system, etc. This option is beneficial when you want to focus on a specific aspect of your design that is related to users’ device, country, language, operating system, screen resolution, etc.
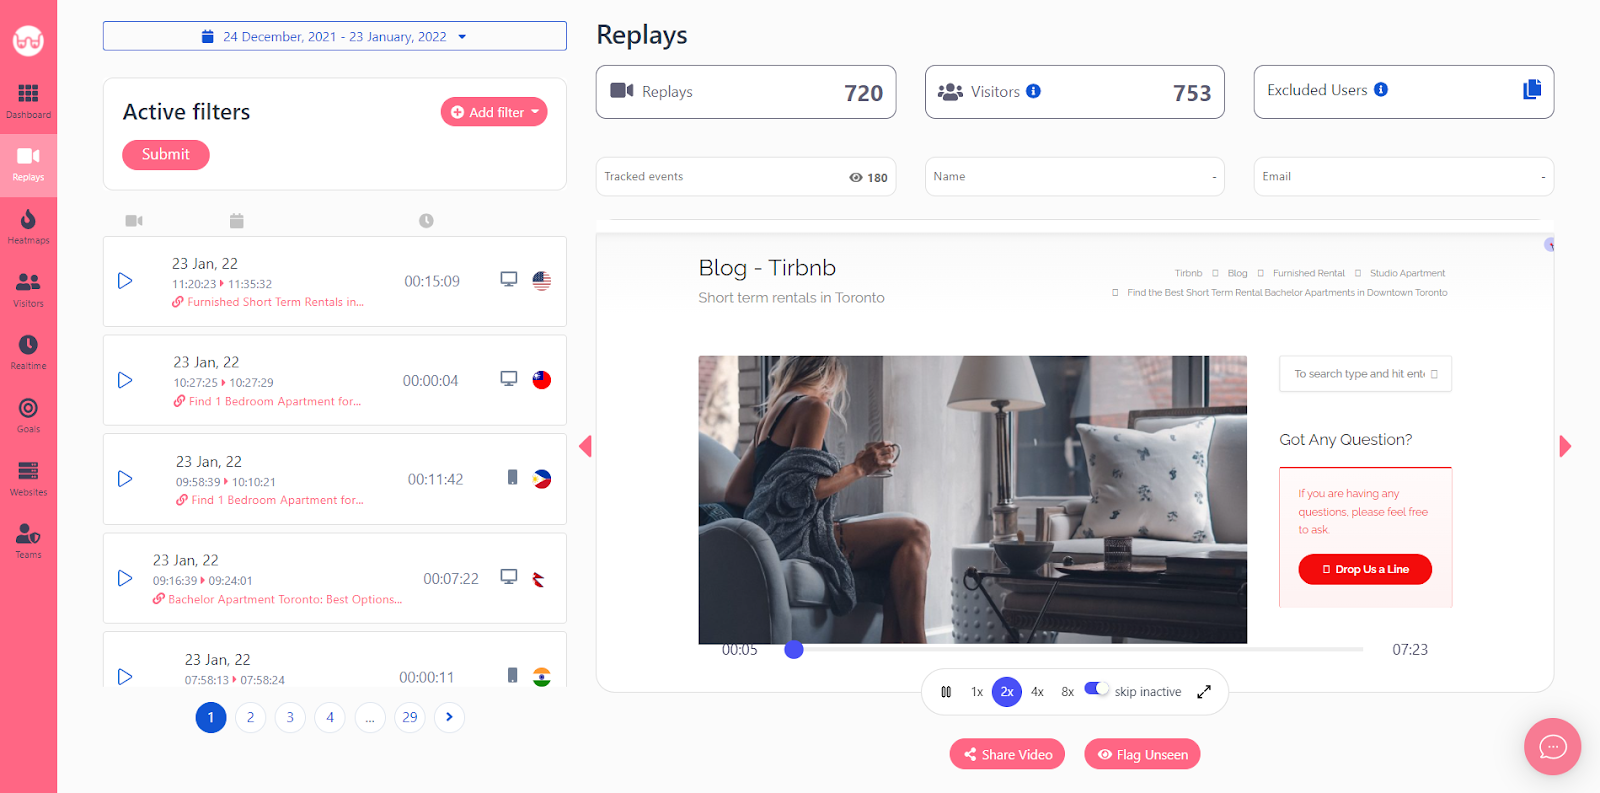
Session replay in Microsoft Clarity is almost similar to WatchThemLive. You can watch visitors’ journeys and access data such as the date, time, duration of their visit, country, device, OS, and the number of pages they have visited. It also shows you their entry and exit page.
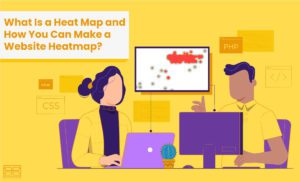
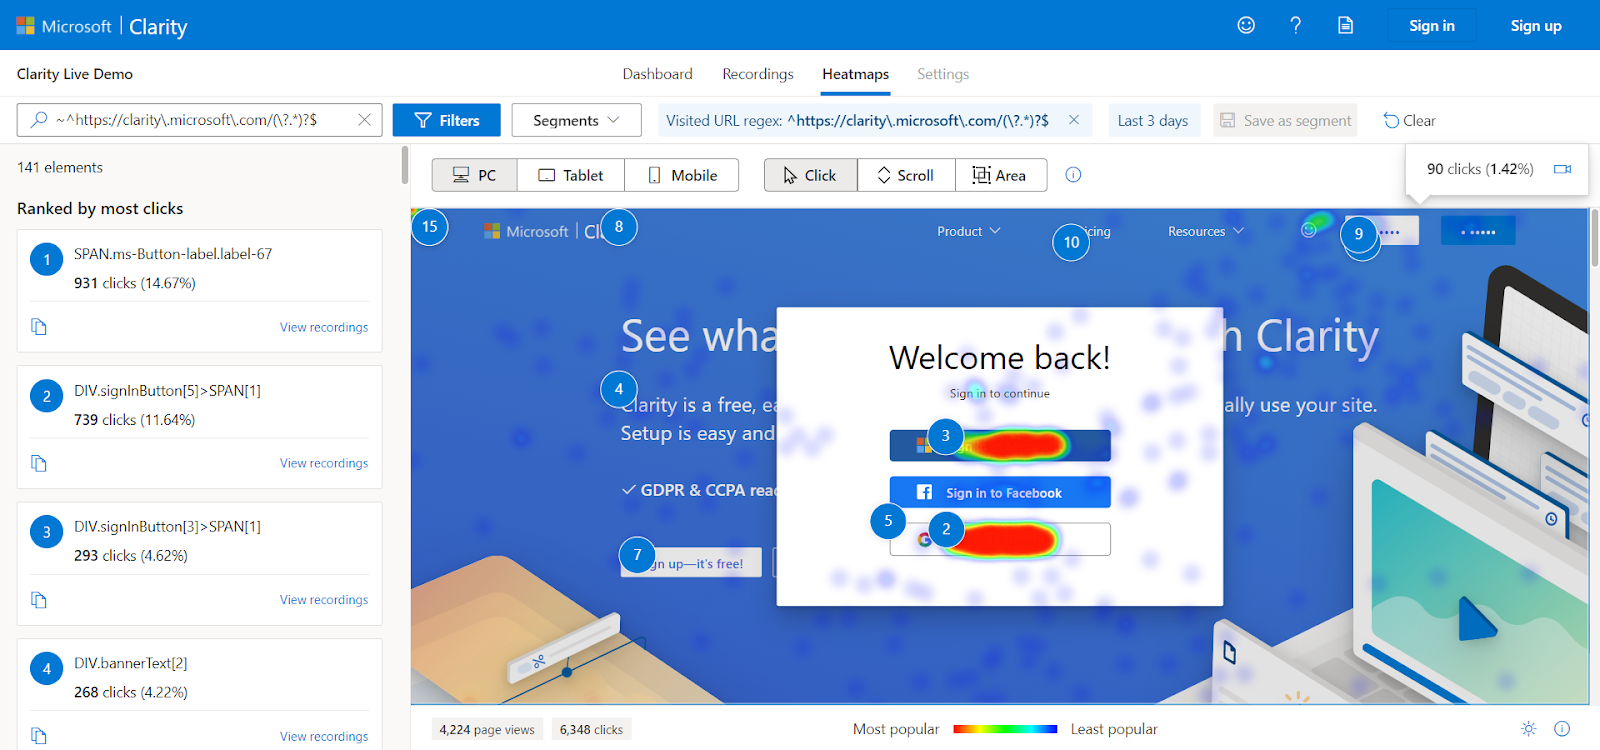
Heatmaps
By creating heatmaps, you can discover your website’s points of strength and weakness. They help you find out the popular areas on your webpage and put your important content in these areas to get a higher CTR.
Heatmaps tell you how effectively your users are able to interact with your website. They can also tell you whether your call-to-action elements are receiving enough clicks. You can make better decisions and improve your business by having this knowledge.
WatchThemLive enables you to create unlimited heatmaps for free. It lets you see heatmaps for each page on desktop, tablet, and mobile mode so that you can focus your analysis on each device separately for your design.
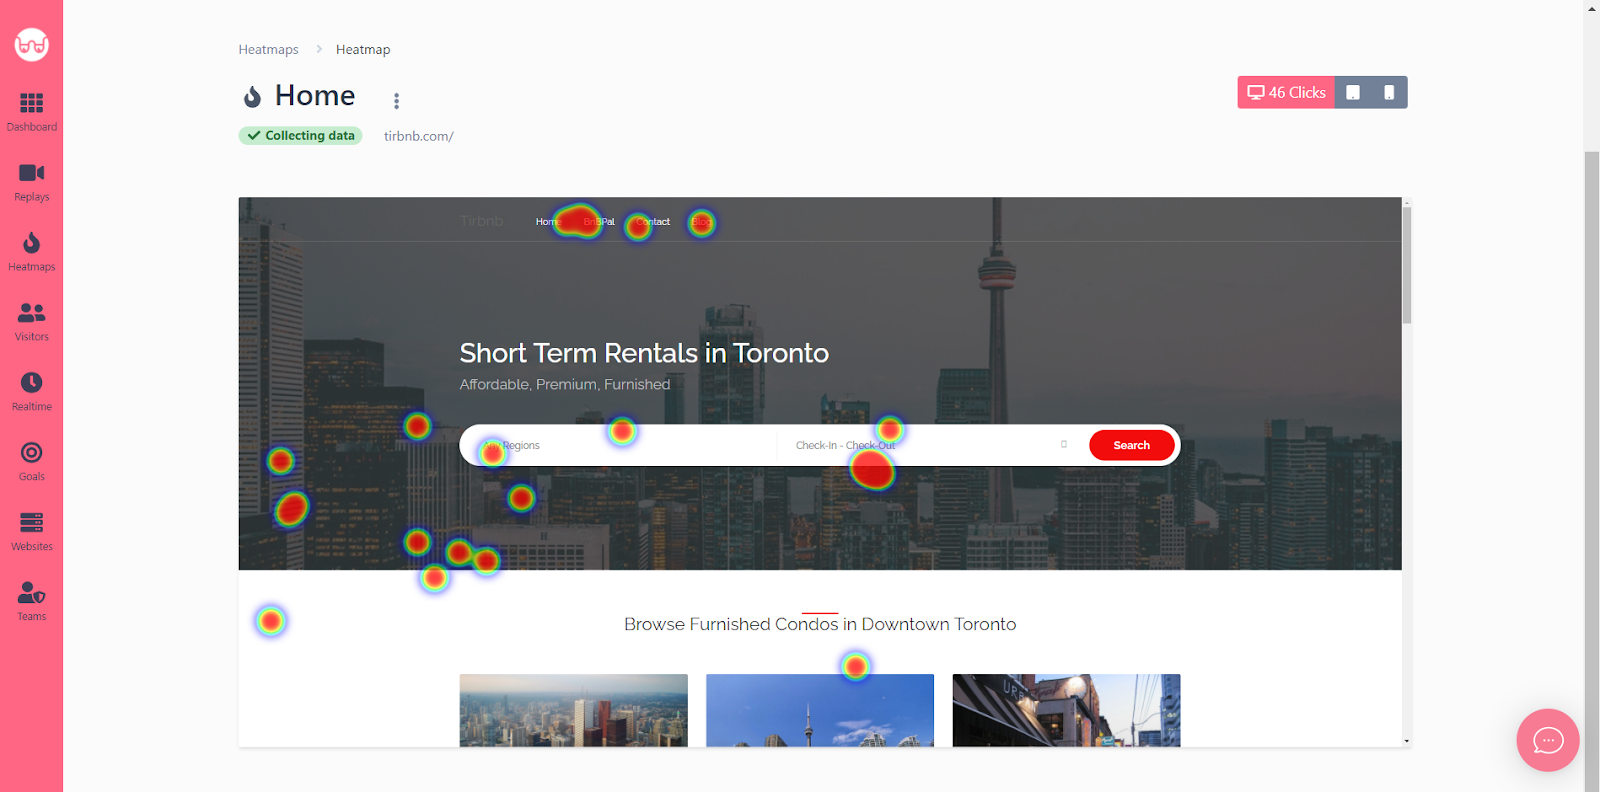
Microsoft Clarity has more interactive heatmaps. It lets you see the number and percentage of times a button has been clicked or tapped.
In addition to a regular heatmap, Clarity has a scroll map feature that shows you what percentage of your visitors have scrolled down to each point of your page.
Goal Tracking
Goal Tracking is a feature that is unique to WatchThemLive in this comparison.
Using this feature, you can set conversion goals to measure your marketing performance by examining the number of visitors that have done the actions that they were expected to do.
Analyzing the data can provide you insights on how to optimize your marketing plan to increase conversions. Tracking your goals enables you to figure out what you need to do to achieve your business objectives.
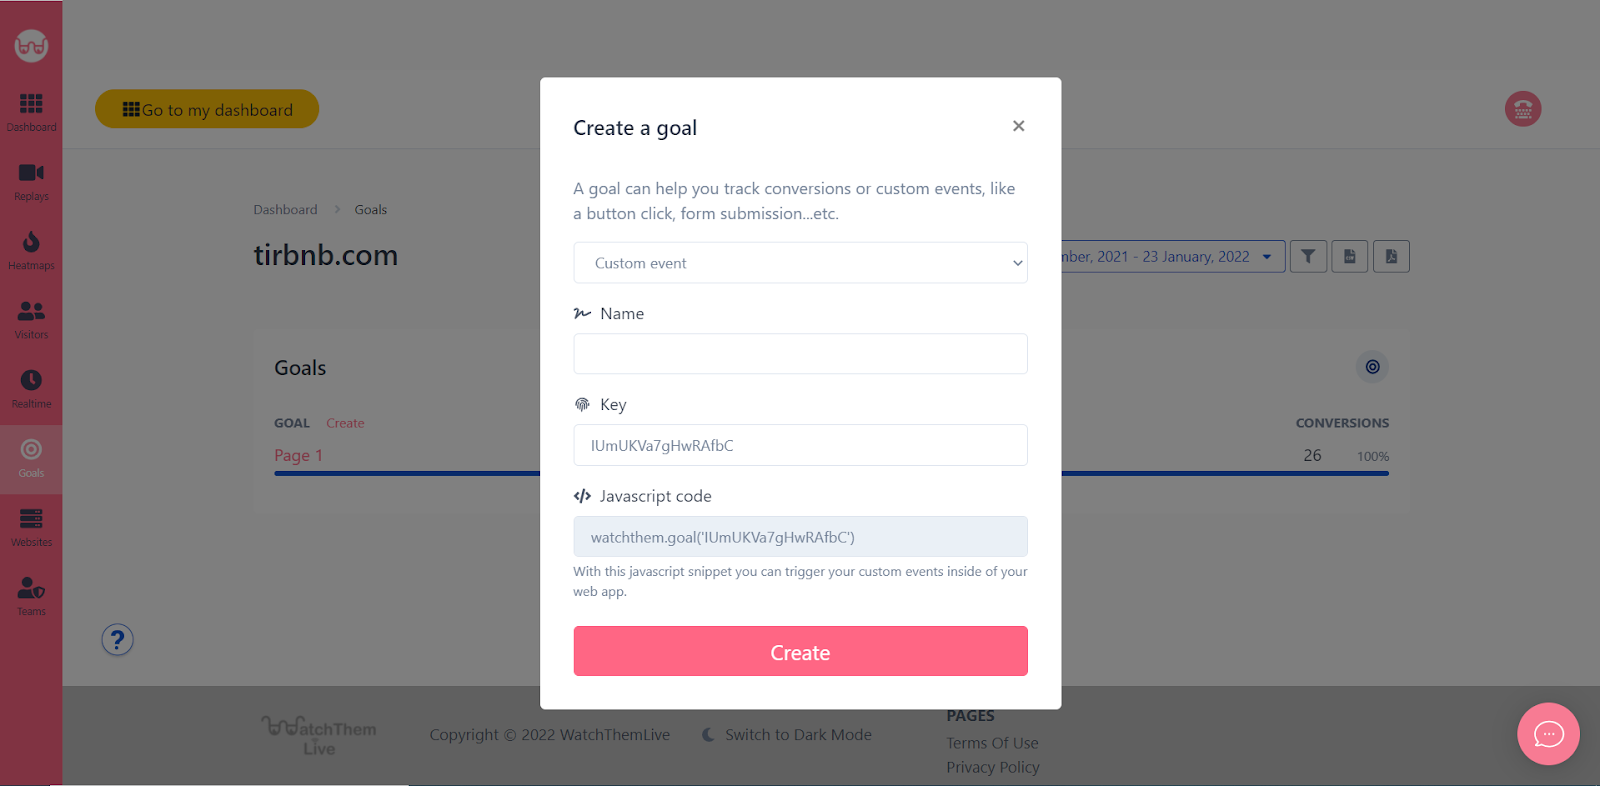
With the goal-tracking feature, you can track things that the already existing analytics can’t. It can be anything from a button click to downloads and specific page views (for example, a thank-you page after a checkout,) etc.
Pageview
The pageview goal is the simplest to set up, and the goal will be completed if a visitor reaches a certain page.
A thank you page that appears after a conversion (newsletter, purchase, form submission, etc.) is a good example of this type of goal.
Custom
These types of goals will require some extra code implemented to the tracked website, which is specified when you create a new goal from the dashboard.
A custom goal is mainly used when you want to track a specific event that happens on your website, which can’t be tracked with the pageview method.
Some examples of where custom goals will be used are:
- Tracking clicks on external links
- Tracking more advanced form submissions
- Tracking clicks on specific parts of your pages
User Tracking
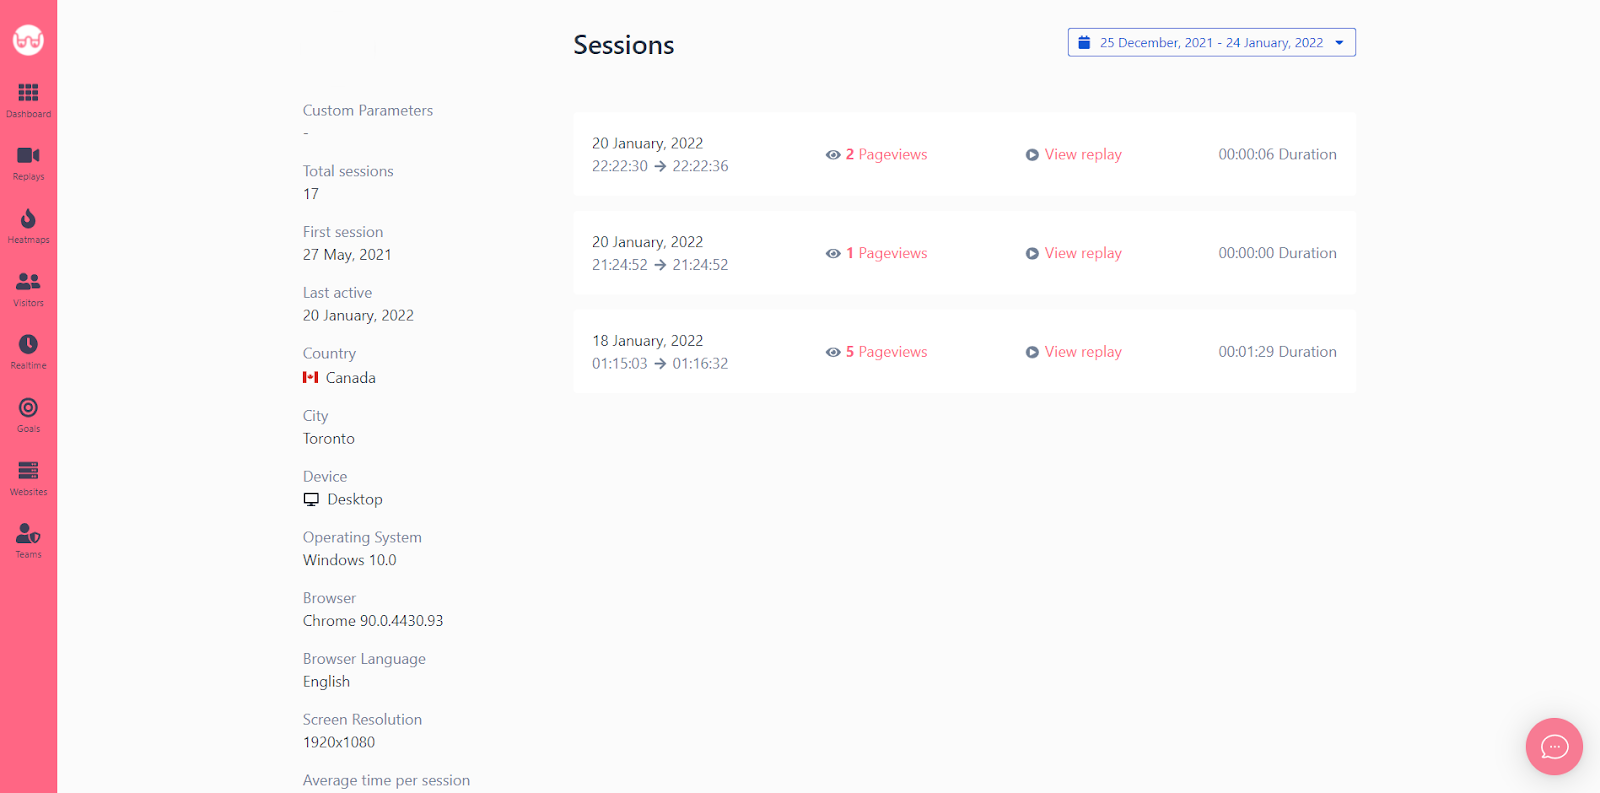
WatchThemLive lets you analyze a given user’s entire journey on your website. It offers you a list of all the individual visitors with their specific information (i.e., the number of total sessions, the date of their first and last activity, country, city, device, OS, browser, browser language, screen resolution, and their average time per session.) You can track each visitor’s activity in one place. This feature enables you to understand how each user interacts with your website and what attracts their attention so that you can personalize their experience. You can also find out what makes them leave your website. These insights will help you improve your website to lower the bounce rate.
To use a similar feature in Microsoft Clarity, you need to find a given visitors’ User ID and use it to filter the results in order to see the list of their activities on your website. Clarity provides data about each visitor as well, although it’s more limited compared to the information WatchThemLive provides in visitor profiles.
WatchThemLive vs. Microsoft Clarity: Integrations
On WatchThemLive, you can choose Google Tag Manager, CMS dashboard, or HTML coding to integrate your tracking code.
You can also integrate WatchThemLive with MyURLs.bio, an Instagram link-in-bio tool. This is a feature that no other platform of this type offers. With this integration, you can easily track user behavior on your link-in-bio page to improve its design and increase conversions.
In the case of Microsoft Clarity, it integrates with Google Analytics data. Integrating your Clarity project with Google Analytics allows Clarity to link session playbacks with your Google Analytics dashboard.
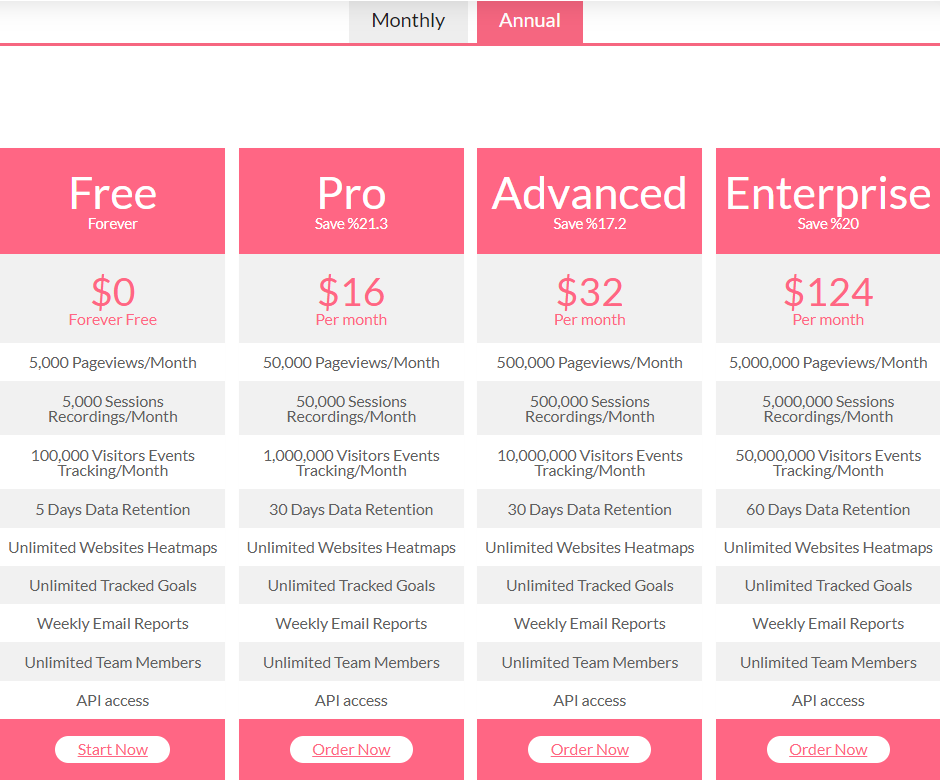
WatchThemLive vs. Microsoft Clarity: Plans and Pricing
WatchThemLive offers a free plan that includes 5,000 session replays and unlimited heatmaps and team members. The tiers and their prices are listed as follows:
- Pro – $9 per month
- Advanced – $39 per month
- Enterprise – $149 per month
You may save a lot of money by purchasing annual or lifetime plans.
On the other hand, Microsoft Clarity is completely free. Microsoft asserts that in order to acquire insights and create the machine learning models that underpin many of its products and services, they analyze a vast amount of anonymized data about user activities. Clarity is one of the ways Microsoft gathers this data, which is why they’ve made it available for free.
Conclusion
WatchThemLive and Microsoft Clarity both have their own unique advantages that make it hard to decide which one is better for your business. You need to consider your expectations of a user tracking tool first to decide which one fits your needs best.
Clarity provides more analytic information and can integrate with Google Analytics. WatchThemLive, on the other hand, has a way more straightforward interface that makes it easier to use. WatchThemLive is, basically, GA but simpler to use. Many users choose WatchThemLive because it’s not easy for everyone to make sense of Google Analytics. Using WatchThemLive, you will have all the necessary data that Google Analytics provides but in a simpler way.
Read more related, informative content: