
Have you recently launched a campaign that wasn’t as successful as you expected?! Do you want to know why your sales have been plummeting, and visitors refuse to click on CTAs on your website?! If you’d like to know the answer and figure out how to improve your website’s UX and UI, you’re in the right place. A Clickmap is a way to go! But what are click maps exactly, and how do they help?!
In digital marketing, the more you get to know your users’ behavior, the better you can satisfy them! That is, you’ll be able to act based on their expectations and provide them with the products and services they need. To that end, we need the best conversion rate optimization (CRO) tools with a click heatmap to tell us what our audience is most interested in and what they ignore.
In this article, you’ll learn everything you need to know about click heatmaps, from definitions to benefits. And at the end, we’ll introduce the best heatmap tool to get you started on your website optimization.
Yet, if you can’t wait to start analyzing your visitor behavior professionally, sign up on WatchThemLive now and get immediate access to the best clickmap and behavioral analytics service out there!
Now, let’s get started with the definition. Ready?
What Is a Clickmap
It’s a type of website heatmap that indicates which areas of your webpage receive the most or least clicks. A heatmap includes different types, such as scroll maps, mouse movement heatmaps, etc.
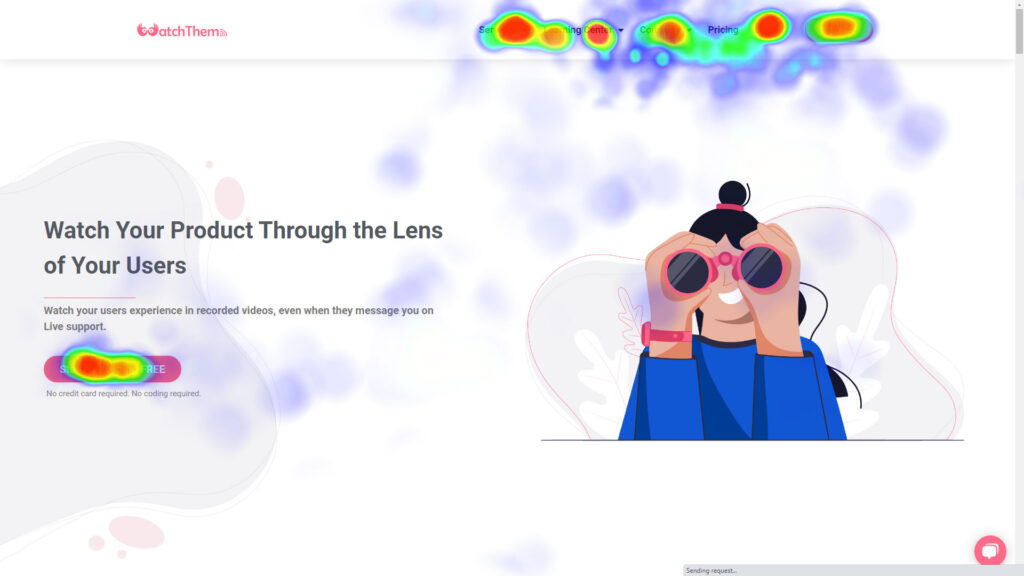
Generally, the following picture is a perfect example to show click maps! It is an image of a webpage marked with different colors. But what does it mean?
In fact, click maps are the visual representation of the areas on a webpage where your visitors tap on the screen or click. The click popularity is displayed using a color scale from red to blue.
That is, the spots colored red indicate the most clickable parts, and those areas colored pale blue display the spots that took minimum clicks. Any place that has no color has never been clicked on.
In addition to its positive impact on identifying the most clicked parts of the site, this type of map can also specify the problems related to linking and help you find a way for eCommerce lead generation. But ‘how?’ You may ask.
Let’s jump into its use cases!
What Can You Learn from Click Maps
By using this type of heatmap, it is possible to identify the user behavior and the number of clicks on some of your website components. This data lets website owners track on-page user engagement, such as clicks on images, links, buttons, etc.
In other words, these maps will help them optimize their web pages and CTAs to increase conversion rates. Here are some of the use cases of a clickmap to optimize the website, improve UX, and enhance conversion:
- Iterating better website designs and adding links to images based on user expectations to improve UX,
- Identifying visitors’ behaviors and predicting where they will click to place links,
- Determining whether CTAs are sufficiently visible to visitors. In addition, determining whether the primary CTA is placed in the most clickable areas or not,
- And, checking your website navigation (menu and links).
If you’re not convinced click heatmaps are worth your money and time, here are some of the situations that they are helpful for website owners:
1. Click Maps Allow You to Add Links to Images Based on Users’ Expectation
With the data related to the clicks made on specific images, you’ll find the most clickable images. Then you can place links on them and direct visitors to your target pages.
Moreover, by knowing the most clickable image, you can replace it to make it more accessible to users.
َA click heatmap is usually an available feature on eCommerce marketing tools because it can be very influential in your digital marketing career. Why? Well, because you can use them to identify your visitors’ behavioral patterns. Then by modifying and adding links to images, you can prevent confusing visitors and improve UX. Let’s give you an example to clarify!
In an online shop, when visitors enter the website and see an image of the product, they usually click on it to go to the product page. But if that image doesn’t have a link to the product page, it will disappoint the visitors, resulting in a high bounce rate.
So, by using clickmaps, the webmaster figures out the most clickable image and understands visitors’ expectation. Then, they can find a way to improve UX and boost conversions.
2. A Clickmap Helps You Understand Where to Place Links
With click heatmaps, you can find out which parts of the webpage are expected to have links. According to clickmaps data, it is possible to find which sections on your website have weak linking. Then, by changing the structure of the webpage and creating links in the appropriate areas, you can improve user experience.
3. A Click Heatmap Lets You Find the Best Place For CTAs
Your website’s Call to Action (CTA) is a component that encourages visitors to take a specific action. Clickmaps show whether visitors clicked on the main CTAs or were attracted to other components on your website. In other words, with the help of a click map, you identify the best spots on your webpage to place the CTAs.
4. A Clickmap Gives You insights into Redesigning Your Site Navigation & Menu
Examining the navigation by considering the data obtained from clickmaps can lead to decisions that improve the user experience. This means that if your website navigation isn’t based on a customer-centric marketing method and doesn’t meet their expectations, you’ll need to make some changes, such as placing a specific button based on their needs.
To wrap up, creating clickmaps answers an essential question: “Where should the most important content (image, link, CTA, etc.) be on this specific page?”
Now, it’s time to dive into clickmaps advantages.
What Are Clickmap Benefits
A click heatmap is one of the most efficient and powerful website visitor tracking tools available to website managers. This tool can provide valuable information related to visitors’ interactions with different pages and sections. So, based on this data, you can improve your website user interface (UI) and user experience (UX) and implement a more innovative design to boost the conversion rate.
Here are other clickmap benefits:
- Testing and measuring your website performance and functionality,
- Identifying underperforming CTAs, images, links, and other elements,
- understanding users’ needs and expectations,
- Finding your website bugs,
- Getting a clearer idea of how to redesign your website (e.g., in order to make a high-converting landing page),
- Reordering the links on the web pages to get a better CTR,
- Improving UI and UX,
- Decreasing bounce rate and increasing your website traffic rate as a result,
- Generating more leads and sales,
- Improve conversions and sales funnel.
Now, you may wonder how clickmaps work. Let’s explain it.
How Do Clickmaps Work
When you connect your website to these tools, a snapshot will be taken from the web pages you have selected before. Then, with the help of the codes loaded on your site, the detailed information will be sent to clickmap tools.
This way, the tool creates a map of your web page where all elements are placed. These are elements that users can interact with, like buttons, images, links, etc. When new users enter your website, the click map codes will check their behaviors and mark their activities.
In other words, every time they click on an element, the click tracking tool records that action and displays users’ data in a graphic report, using the color scale (from red to blue) to visualize their interactions with your website.
In today’s day and age, we’re surrounded by various analytics tools that provide clickmaps. That’s why our decision-making process for choosing the right tool has become so complicated. So, In the next section, we recommend the best tool that not only offers click heatmaps but will also equip you with other impressive features to identify users and increase the conversion rate. Ready?
What Is the Best Clickmap Tool
WatchThemLive is an all-in-one behavioral analytics and CRO tool that enables you to understand all your visitors’ behavior and interactions with your website. It enables you to identify the reasons behind their specific actions, figure out their expectations, find your website bugs and underperforming elements, and understand how to fix them.
You can sign up now and get instant access to its FREE plan!
Now, let’s see how this tool works and what else it provides!
WatchThemLive: The Best Clickmap Tool
All types of heatmaps (e.g. mouse, scroll, eye-tracking, and click heatmaps) are visual representations of data. Different colors indicate your website user engagement, with red being the ‘hottest spots’ and blue being the coldest.

If you were to name an essential element of your landing page, what would it be? CTAs, I bet. WatchThemLive’s click heatmap will show you any button click frequency in a visualized form. So by using them, you can identify the most clickable spots for placing your CTAs.
You might wonder:
How Do WatchThemLive’s Clickmaps Help You
Other common analytics software only show you how many visitors entered your site and what percentage of them converted to customers. But they can’t help you understand the interactions that happened in-between these two parts, i.e., ‘entering the site’ and ‘conversion.’
In contrast, WatchthemLive is all-inclusive behavioral software that tracks the entire customer journey. It offers all information about their interactions with your website from the moment they enter the site to the moment they leave.
Let’s put forward an example!
Imagine that 1000 visitors enter your website daily, but only 20 of them make successful purchases. Therefore, you must know why the other 980 people leave your website. Their reasons might be different. Maybe they just couldn’t find the ‘add to cart’ button. With the help of WatchThemLive’s free click-tracking service and other features like session replays, you can access all visitors’ journeys.
Now, by knowing the reason why visitors leave your website without buying products, you can find a way to fix the problem and provide a better UX to turn more users into potential customers. Amazing, isn’t it?!

If you’re interested to learn more about its features, read on!
WatchThemLive’s Other Features
Besides, this tool offers other analytics features, including:
- Session replays: This service tracks every movement of your visitors and provides a playlist of their sessions. Moreover, there is a console error under their session to show you all errors that occurred on their journey. You can also export data into CSV or PDF.
- Analytics dashboard: Its website analytics service offers a wealth of data about your website and visitors. WatchThemLive’s analytics features enable you to deliver better UX, improve content, and attract more traffic.
- Goal tracking: Want to know how many visitors complete your pre-set goal? Well, with the help of WatchThemLive’s goal tracking, you can add unlimited objectives and track users’ performance.
- Visual live chat: Are you struggling with finding out what a user’s problem was when they left a message on the chat box?! Don’t worry. WatchThemLIve’s visual live chat feature enables you to access the users recorded session after they ask you their questions. Therefore, you’ll find their issue and fix it in the fastest way. Pretty straightforward, right?!
- And, video testimonials: This key feature makes WatchThemLive stand out from its competitors. By using it, gathering customer feedback is no longer difficult and time-consuming. This service displays pre-set questions on your users’ screens; all they need to do is answer the question while recording the video.
Sign up now, create a free clickmap and boost your website conversion!
Not convinced yet?! Read this complete WatchThemLive review and learn more about it!
FAQs on Clickmaps
So far, we have explained all the information about tracking clicks on the website and its benefits and best tool. Now, Let’s answer some frequently asked questions regarding click tracking. Shall we?!
1. What Does a Click Map Reporting Tell You?
How many clicks does your website get? Well, clickmap is a graphical representation of the areas of your website where your visitors click or tap. This service lets you track user activities and see which links, buttons, or text they click on, as well as the areas that are being ignored and left unclicked.
2. Why Is Click Tracking So Important?
It is an important part of data analysis since it enables you to track and analyze your visitors’ interactions and identify the reasons behind their behavior- by seeing where they (don’t) click. It will give you valuable data to improve UX and turn more users into customers.
3. Who Will Benefit From Using Clickmaps?
Let’s talk about the people who can take advantage of tracking clicks on websites:
Product owners Visualize and analyze their user behaviors and make their website design and product page more attractive for them. Finally, they will act based on users’ expectations and deliver better UX.
UX designers can use a clickmap to deliver a great user experience. They analyze the behavior of users on the website and optimize the position of buttons and other elements on the page. By using click heatmaps, they will save testing costs.
Digital Marketers use click heatmaps and A/B testing to identify the underperforming parts of the website and test ways to improve them. Eventually, they will convert more users into potential customers.
4. How Do I Track Clicks on My Website?
Here’s how to use WatchThemLive’s click heatmaps:
- First, register or login to your account,
- add your website and choose one of the integration methods (Google Tage A manager, CMS dashboard, an HTML page),
- Now, you have access to WatchThemLive’s dashboard,
- Click on the heatmap button on the left toolbar,
- Press the ‘Add new’ button to track clicks on a specific page,
- And all you need to do is name the heatmap and add your URL to access the clickmap!
5. What Is the Use of the Click Map Feature in Email Marketing?
It is a helpful tool for analyzing email campaign reports. To clarify, click maps give you an opportunity to know the areas on emails where your subscribers click most or least, then, you can create a series of follow-up emails or rearrange links on your email campaigns.
6. Does Google Analytics Have a Click Map?
Yes, it has a Chrome extension for tracking your webpage clicks called Page Analytics. However, there are no updates in Page Analytics features because it was deprecated in 2019 and has stopped working for the majority of the users recently.
So, if you want to save money and time, choose the best CRO tool like WatchThemLive to cover these limitations. Sign up now and use its click heatmap feature for in-depth insights into users’ behaviors on your website.
Conclusion
Click map is an excellent feature of any behavioral analytics tool that analyzes your website visitors’ behaviors. By knowing your users’ needs and expectations, you’ll design your webpage as they wish. This means that you can modify your webpage design to improve UX, find and eliminate the bugs in the customer journey, and eventually boost your conversion and sales funnel.
One of the successful tools you can use to create click heatmaps for free is WatchThemLive. Sign up now to look deeply into your customers’ behaviors and avoid cart abandonment.